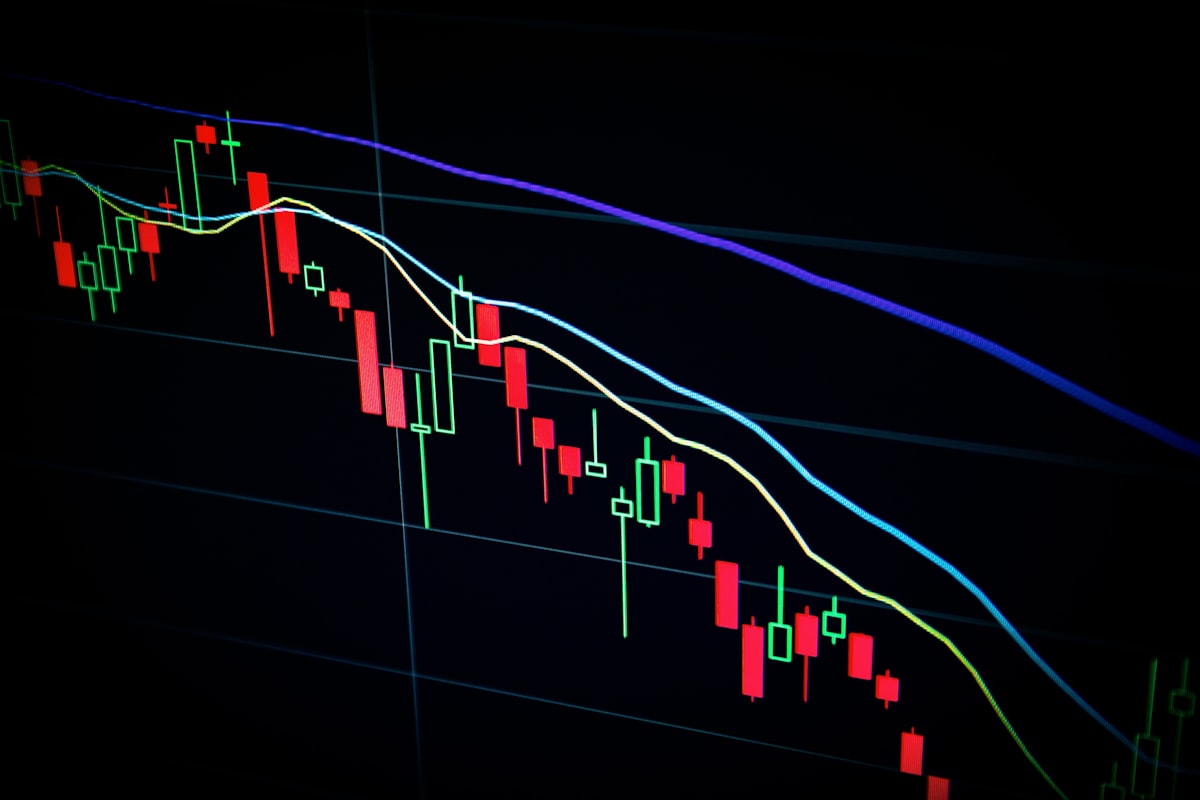
Win rate is the most quoted trading metric and the most misleading. Traders share screenshots of 8-for-10 days and call it skill. But without the corresponding average win and average loss sizes, the win rate is meaningless. What matters is expectancy.
The formula every trader needs to know
Expectancy is the average amount you make per trade, in R multiples, over a large sample. The formula is: Expectancy = (Win Rate × Average Win) − (Loss Rate × Average Loss). A strategy with 45% win rate and 2:1 R:R has an expectancy of (0.45 × 2) − (0.55 × 1) = 0.90 − 0.55 = +0.35R. That is a profitable strategy.
Compare that to a strategy with 70% win rate and 0.5:1 R:R: (0.70 × 0.5) − (0.30 × 1) = 0.35 − 0.30 = +0.05R. Barely profitable, and fragile — any slight decrease in win rate turns it negative.
Why high win rates feel good but can destroy accounts
High win rate strategies are psychologically comfortable. Winning 7 out of 10 trades creates a feeling of control and competence. The problem is that high win rate strategies typically achieve their win rate by using wide stops or moving stops to breakeven early — which cuts the average win dramatically.

Expectancy tells you whether you have a real edge — win rate alone does not.
- A 40% win rate strategy with 3:1 R:R has +0.60R expectancy
- A 70% win rate strategy with 0.4:1 R:R has +0.08R expectancy
- The first strategy makes you 7.5× more per trade, long-term
- But the second one feels better day-to-day
How to measure your actual expectancy
Open your trade journal and calculate the average R earned on winning trades and the average R lost on losing trades. Multiply by win and loss rates respectively. The result tells you whether you have a real edge — not your recent equity curve, not your last week, but your actual statistical expectancy over your full trading history.
TradlyHub's Performance Analytics section calculates this automatically once your MT5 account is connected. You can see your real expectancy per instrument, per session, and per setup type — without having to run the numbers manually.