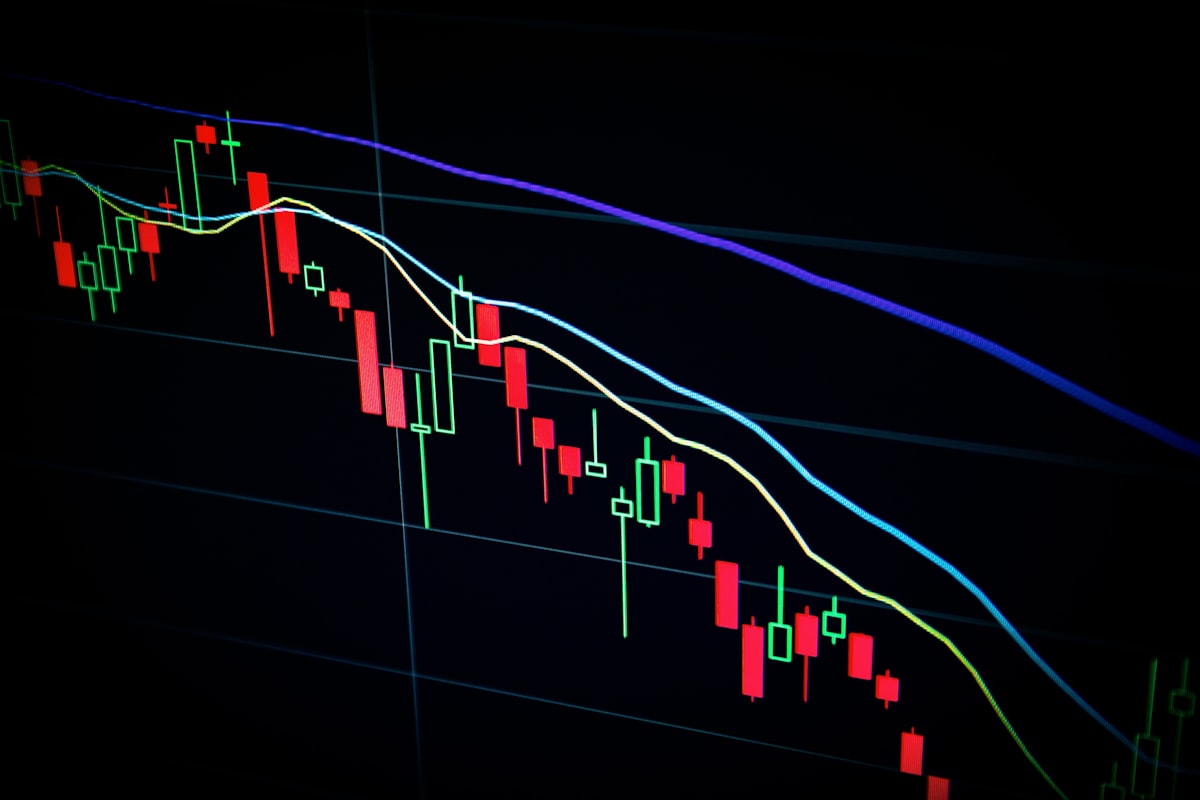
Your MT5 account history is a goldmine of data about your actual trading behavior. Not the trading you think you do — the trading you actually do. These seven numbers, extracted and analyzed correctly, will tell you more about your edge than any course, mentor, or strategy you will ever encounter.
1. Expectancy per instrument
Calculate your average profit per trade separately for each instrument you trade. You will almost certainly find that 2–3 instruments account for most of your positive expectancy, while 2–3 others are net negative. Stop trading the net-negative instruments.
2. Best and worst trading hours
Group your trades by the hour they were opened. Most traders have a clear 2–3 hour window where their win rate and R:R are significantly above average — and several hours where they consistently lose. Trading only during your best hours is one of the highest-leverage changes you can make.
3. Average holding time on winners vs. losers
If your losing trades are held longer on average than your winning trades, you are cutting winners and letting losers run. This is the single most common and most damaging trading mistake. The data will tell you immediately.

Raw MT5 trade history, organized by key metrics, reveals patterns you cannot see trade-by-trade.
4. Win rate after a loss (tilt indicator)
Calculate your win rate on the trade immediately following a losing trade. For most traders, this number is significantly below their overall win rate — evidence of revenge trading or trading while emotionally compromised. Knowing this number tells you whether a mandatory pause after losses should be a rule in your plan.
- Expectancy per instrument — find your best and worst pairs
- Win rate by session — London, NY, Asian, overlap
- Average hold time: winners vs. losers
- Win rate after a loss — tilt detection
- Return on risk per day of week
- Drawdown depth and recovery time
- Net P&L per setup type (if tagged in journal)
How to get these numbers automatically
TradlyHub syncs your full MT5 history and calculates all of these metrics automatically. Connect your broker account once, and every trade you have ever taken — along with all the derived statistics — appears in your analytics dashboard. No spreadsheets, no manual export, no formulas.